Network Pavement Condition Surveys
How network-level pavement surveys with vision AI turn thousands of road kilometres into a ranked maintenance list, instead of whoever shouts loudest.
A road agency rarely lacks roads to fix; it lacks a fair order to fix them in. A network survey drives every maintainable kilometre with calibrated imagery and LiDAR, grades cracking, rutting and potholes with vision models, and scores each 100-metre segment on a Pavement Condition Index. Maintenance money then follows the ranked list instead of political pressure.
Every road agency knows the same frustration. The maintenance budget covers a third of what needs doing, and the order of work is decided by complaints, not condition. A network pavement survey ends that argument with a ranked list nobody can dispute.
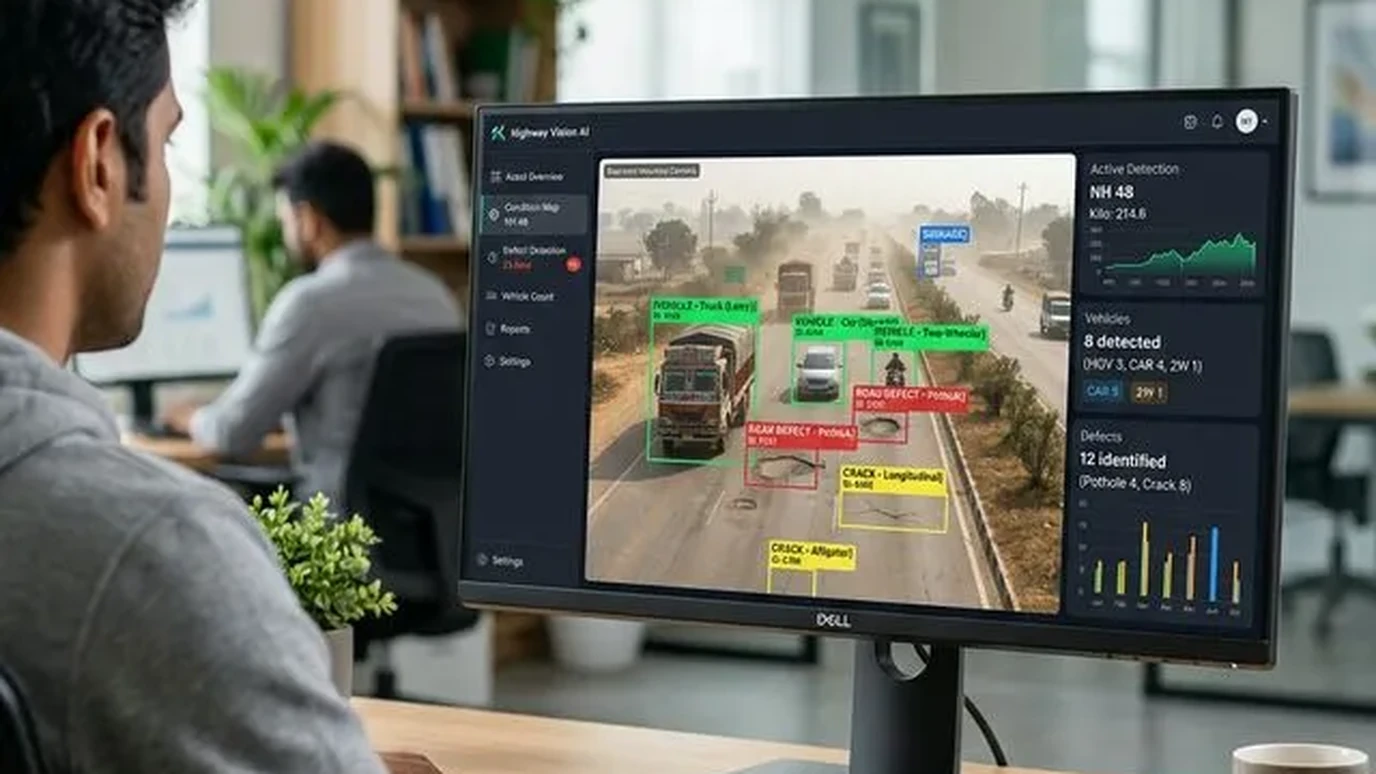
The problem with fixing roads by complaint
Without measured condition, three things go wrong. Politically loud stretches get resurfaced while structurally failed ones wait. Thin overlays are spent on roads that needed reconstruction, wasting the money twice. And nobody can show what last year's budget actually bought, because there was no before-score and no after-score.
A Pavement Condition Index survey fixes all three. It converts the network into numbers, programmes the work by value, and leaves an auditable trail from budget to outcome.
What a network survey collects
A survey vehicle carries complementary sensors, each covering what the others miss:
- High-resolution surface imagery, the primary distress record: alligator, longitudinal and transverse cracking, block cracking, potholes, patching, ravelling, bleeding.
- LiDAR profiles: rut depth, undulation and roughness that a photograph flattens out, measured in millimetres across the lane.
- RTK GNSS and chainage: every frame located to the agency's own chainage system, so the PCI layer joins the existing asset register without translation.
- Right-of-way context: carriageway width, shoulder condition and encroachment flags that feed the maintenance estimate.
On a 220-kilometre state highway programme, a two-person crew completed capture in under a week, including urban bypasses run at off-peak hours. (Geopage project data.)
From imagery to a ranked list
This is where the AI road asset inventory pipeline earns its keep. Vision models trained on Indian pavement distress classify every defect by type and severity, and the scores aggregate into PCI per 100-metre segment. Human reviewers audit a sampled fraction, the QA loop that keeps the model honest and the report defensible.
The output is a maintenance programme, not a data dump: segments ranked worst-first, grouped into preventive maintenance, overlay and reconstruction bands, with quantities an estimator can price. Run the survey again next year and you get deterioration rates, the number that tells you whether the strategy is working.
PCI plus safety, plus assets
Condition data multiplies in value when it shares a datum with everything else. The same chainage carries road safety audit findings, culvert and drain inventories, and the GIS asset register, so a single corridor view shows surface, safety and structures together. That is the difference between a survey report and an asset management system, and it is exactly what programmes like Smart Cities and state road development corporations are now specified to receive.
Related reading and services
- AI road asset inventory at scale: the vision pipeline behind the scores.
- What happens in a road safety audit: the safety half of the corridor picture.
- Geospatial AI and computer vision: distress detection models and PCI analytics.
- Infrastructure asset management: from PCI layers to funded programmes.
Measured, not negotiated
Maintenance budgets are never enough, which is precisely why the order of work must be measured, not negotiated. A PCI survey gives every kilometre a score, and every score a reason.
Responsible for a road network's maintenance backlog? Talk to Geopage about a network PCI survey →
Frequently asked questions
What is the Pavement Condition Index (PCI)?+
A 0 to 100 score for a road segment built from the type, extent and severity of visible distresses: cracking, rutting, potholes, patching, ravelling. It is the common currency that lets an engineer compare a city arterial with a rural road on one scale.
How is a vision-AI survey different from a manual inspection?+
Speed, consistency and evidence. A vehicle pass records every metre with imagery an auditor can rewind, while models grade distress the same way on kilometre 1 and kilometre 1,000. Manual chainage-wise inspection is slower, subjective, and impossible to re-audit.
Can you survey at traffic speed?+
Yes. The imaging and LiDAR payloads are designed for normal traffic speeds on highways, so lanes stay open and the crew is never exposed on foot. Dense urban streets are run slower for complete coverage at junctions.
What does the agency actually receive?+
A GIS layer with PCI per segment, distress-wise quantities, geotagged imagery for every defect, a ranked maintenance programme under the available budget, and year-on-year deterioration rates once the second survey exists.
Does this replace a road safety audit?+
No, it complements it. PCI describes the surface condition; a safety audit under IRC:SP:88 examines geometrics, junctions, signs and roadside hazards. The two datasets share the same chainage system, so they combine cleanly.
Related insights
More perspectives from our engineering team on related topics.
WebGIS Asset Registers for Municipalities
A GIS nobody opens is a map, not a system. How PostGIS-backed WebGIS registers turn road, water and drain inventories into daily municipal tools.
Read ArticleDrone Surveys for PMGSY Rural Roads
How drone topography, DGPS control and GIS keep rural road DPRs tied to the ground: fewer deviations, faster sanctions, cleaner bills.
Read ArticleChange Detection for Dams and Structures
Epoch-to-epoch laser scanning that separates real structural movement from survey noise, for dams, heritage, mines and high-rises.
Read Article