USV Bathymetry for Reservoirs and Dams
How unmanned surface vessels map reservoir beds, siltation and dam approaches safely, and why bathymetry belongs in every storage audit.
A reservoir loses storage to silt every year, and you cannot manage what you have not measured. An unmanned surface vessel runs planned transects with an echo sounder, positions every sounding with RTK GNSS, and builds a bed surface that is differenced against the original contours. The result is a defensible capacity table, a siltation map, and dredging quantities a tender can use.
A dam's live storage shrinks a little every monsoon, and most owners discover how much only when the water doesn't stretch as far as the ledgers say. The silt is invisible from the bund. The only honest way to account for it is to go out on the water and sound the bed.
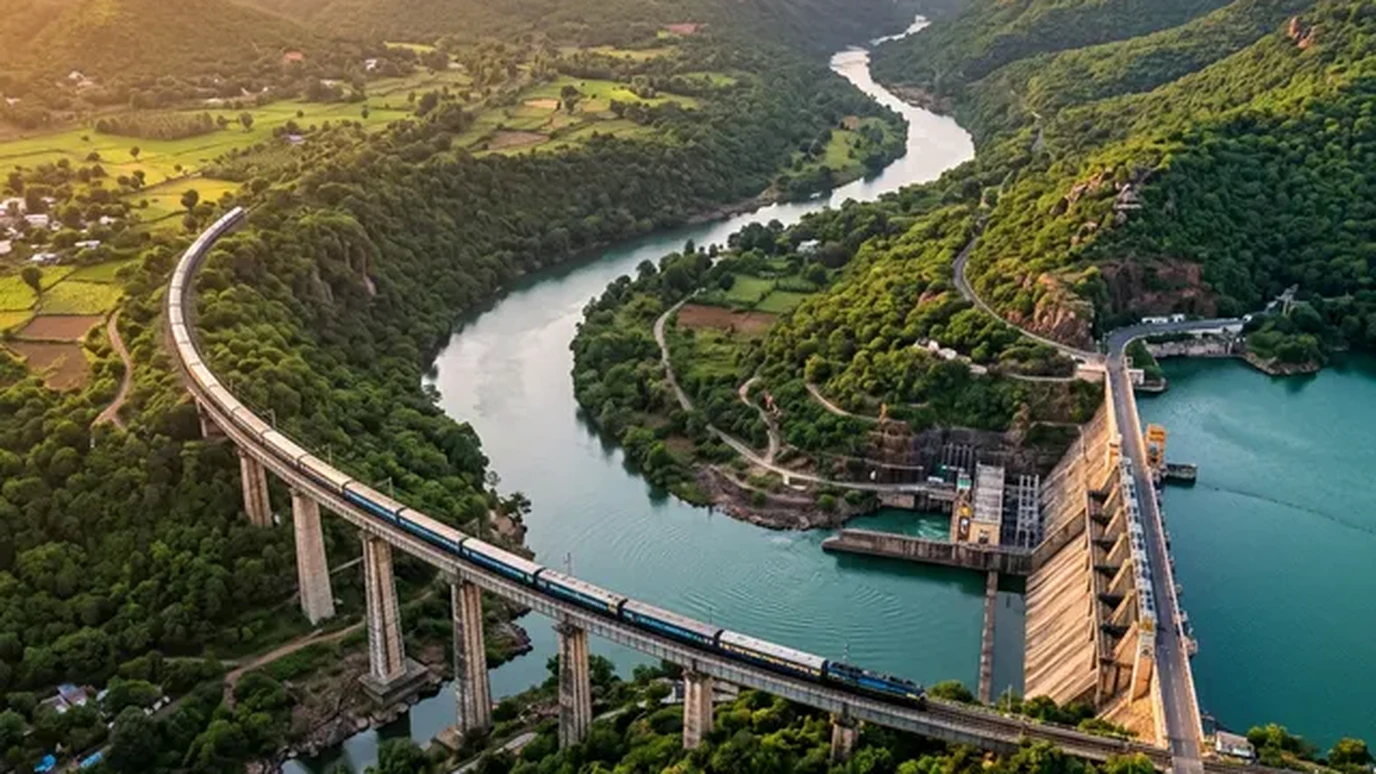
Why reservoirs need sounding, not estimating
Every reservoir traps sediment. The dead storage fills first, then the silt starts eating live storage, the water the project was actually built to deliver. Design documents give you the original capacity. They say nothing about year twelve.
The standard failure mode runs like this. Irrigation releases are planned against a capacity table that no longer reflects the bed, hydrology models inherit the error, and by late summer the shortfall arrives as a surprise. A bathymetric survey replaces the surprise with a number.
How a USV survey actually runs
An unmanned surface vessel is a small robotic boat carrying a survey-grade echo sounder, an RTK GNSS rover and sometimes a compact motion sensor. The workflow is straightforward:
- Project datum first. Shore control is established on the same datum as the dam's drawings, so bed levels and bund levels speak the same language.
- Planned transects. Lines run perpendicular to the reservoir axis at fixed spacing, denser near the dam face, intakes and inflow deltas where silt accumulates fastest.
- Sound velocity calibration. A bar check or sound-velocity cast corrects the sounder for water temperature and turbidity. This step gets skipped by amateurs, never by us.
- Tide and draft correction. Every sounding is reduced for the vessel's draft and the water level at the time of the pass, logged against a shore gauge.
The vessel holds lines a manned boat cannot: shallow margins, the exclusion zone near the spillway, the approach to the intake tower. Where the specification demands wall-to-wall coverage instead of transects, a multibeam head replaces the single-beam sounder.
From soundings to decisions
Raw soundings become a triangulated bed surface, and the bed surface becomes the products an engineer or a tender committee can use:
- Depth contours and cross-sections on the project's own chainages, so the new survey overlays the original drawings directly.
- An updated elevation-capacity table, the single most valuable page in the report.
- A siltation map, produced by differencing the new surface against the previous survey or the original contours, showing exactly where the sediment went.
- Dredging quantities with locations and lead distances, ready for a bill of quantities.
On a medium irrigation reservoir in Karnataka, repeat USV surveys three years apart quantified roughly 4% live-storage loss concentrated in the upper inflow delta. That moved the desilting budget from "the whole lake" to two defined compartments. (Geopage project data.)
Where bathymetry fits Geopage's stack
Bathymetry rarely travels alone. The bed surface merges with drone and LiDAR topography of the foreshore into a single terrain model, and on water-supply projects the combined model feeds directly into multi-village scheme design and hydraulic modelling. For dam owners, the same vessel pass that maps silt also inspects the upstream face approach and intake surroundings that divers and ROVs charge far more to reach.
Related reading and services
- Reality capture and precision surveying: USV bathymetry, LiDAR and DGPS from one team.
- Designing multi-village water supply schemes: where capacity numbers get used.
- Drone vs LiDAR for topographic surveys: mapping the dry half of the catchment.
- Civil engineering and hydraulic modelling: EPANET and SWMM models built on surveyed terrain.
Measure the half you cannot see
Storage you cannot measure, you cannot manage. A USV survey turns a reservoir's invisible half into drawings, tables and quantities: the basis for desilting tenders, release planning and honest water accounting.
Planning a reservoir capacity or siltation study? Connect with Geopage's hydro-survey team →
Frequently asked questions
What is the difference between bathymetry and a topographic survey?+
Topography maps dry land with LiDAR, drones or total stations. Bathymetry maps the underwater bed with an echo sounder. A reservoir capacity study needs both, tied to the same datum, so the shoreline and the bed meet without a step.
Why use an unmanned vessel instead of a manned boat?+
A USV holds a straight transect at constant speed in water a manned boat cannot safely enter: shallow margins, near-dam faces, intake zones. It is cheaper to mobilise, runs repeatable lines for epoch comparison, and keeps crew off the water.
How accurate is USV bathymetry?+
With RTK positioning and a calibrated single-beam sounder, bed soundings are typically good to a few centimetres plus a small fraction of depth. Multibeam gives full coverage where the specification demands it. Accuracy is always stated against the project datum, not as a brochure number.
How often should reservoir capacity be resurveyed?+
Most utilities resurvey on a 3 to 5 year cycle, or after major flood seasons that move large sediment loads. The capacity table from each survey becomes the baseline for the next, so siltation rates are measured, not guessed.
What deliverables come out of a bathymetric survey?+
A triangulated bed surface, depth contours, cross-sections on project chainages, an updated elevation-capacity table, a siltation and change map against the previous survey, and dredging quantity estimates with locations.
Related insights
More perspectives from our engineering team on related topics.
Change Detection for Dams and Structures
Epoch-to-epoch laser scanning that separates real structural movement from survey noise, for dams, heritage, mines and high-rises.
Read ArticleDrone Surveys for PMGSY Rural Roads
How drone topography, DGPS control and GIS keep rural road DPRs tied to the ground: fewer deviations, faster sanctions, cleaner bills.
Read ArticleWebGIS Asset Registers for Municipalities
A GIS nobody opens is a map, not a system. How PostGIS-backed WebGIS registers turn road, water and drain inventories into daily municipal tools.
Read Article